Mobility data is foundational for fairer transport systems, say city leaders
27 July 2020
by Sarah Wray
Cities worldwide have been disrupted like never before by COVID-19 – all citizens have been affected but not necessarily equally. In the US, for instance, evidence suggests that Black communities have been disproportionately impacted by the virus in terms of deaths, job losses, risk of exposure and more.
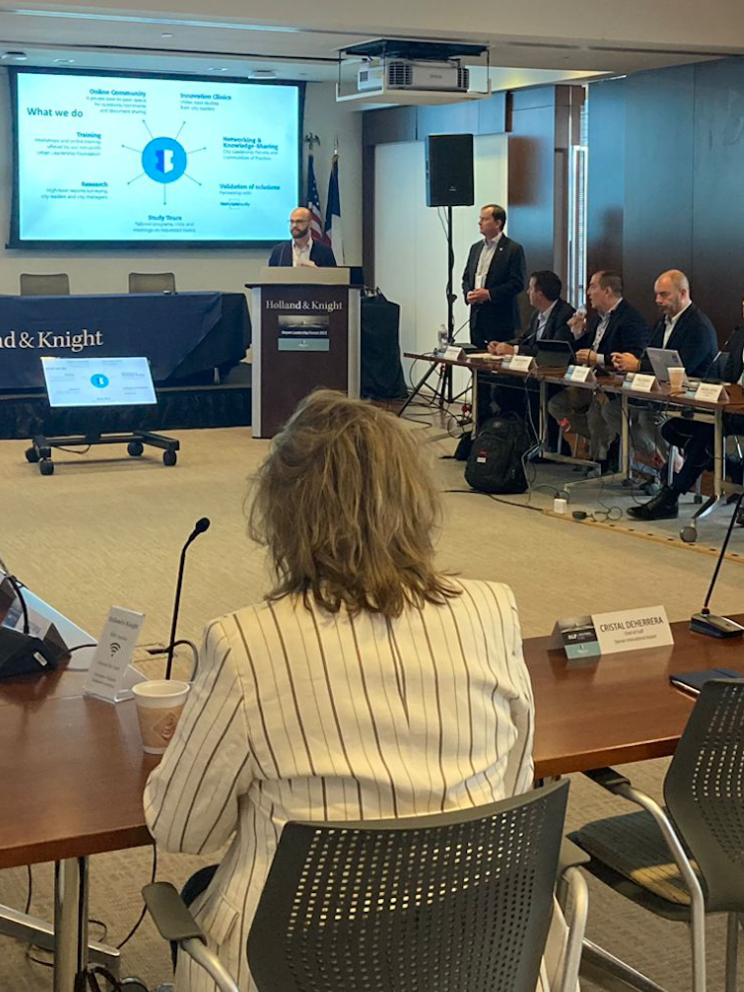
Mayors have vowed to put a renewed focus on inclusive and equitable cities as part of the recovery effort, including transport. Mobility leaders at a recent Cities Today Institute digital roundtable detailed how a combination of quantitative and qualitative data is fundamental to this effort.
Seleta Reynolds, General Manager, Los Angeles Department of Transportation (LADOT), said the societal and financial impacts of the pandemic are causing her team to “think deeply about ourselves, and to have some existential conversations about why we’re here, what we do and why it matters”.
She explained how data from sources such as the city’s Automated Traffic Surveillance and Control (ATSAC) system, the California Healthy Places Index and transport analytics company StreetLight Data was analysed to understand travel trends during the initial phases of the COVID-19 emergency, compared to January and February.
This data was overlaid with information such as results from an LA Metro via Transit App survey, and insights from Housing and Community Department FamilySource Centers, the Angeleno Campaign card assistance programme, Economic and Workforce Development Department’s Rapid Response Centers, and the Mayor’s Office of Public Engagement.
Multi-layered story
The number of vehicle trips in LA spiked immediately following the declaration of the state of emergency in early March, before falling by around 50 percent once Safer at Home (SAH) orders were in place order later in the month and then beginning to creep up again as some rules were relaxed. Cities around the world have reported similar patterns.
“But that wasn’t the whole story,” Reynolds said. “We started to see a picture of a city that was being affected in really different ways by the pandemic.”
For example, the data revealed that people in poorer communities made fewer trips, but drove for longer periods during SAH orders. Further, people in poorer communities reduced their vehicle miles travelled (VMT) less than those in more affluent neighbourhoods, and residents in majority Black and Latino areas decreased their VMT less than all other areas.
One of the things that was happening is that “people in low-income neighbourhoods were starting to drive for money,” Reynolds said, explaining that there was an uptick in these residents taking on delivery work due to unemployment and a surge in demand.
“This really calls on us to consider the kinds of services we offer,” she commented. “We need to have a realistic understanding of the kinds of jobs that are available to people, who’s likely to be doing those jobs for the foreseeable future, and whether or not the suite of services that we currently offer really connects everybody to opportunity in the same way.”
For example, LADOT established a new service to install temporary food pick-up zones near restaurants to help support delivery drivers and restaurants. Reynolds said this analysis work is also sparking additional conversations with residents and businesses about issues such as kerb management, how street food vendors can benefit from the Al Fresco outdoor dining programme and other ways that specific communities could be better supported by LADOT longer-term.
Repurposing streets
As cities quickly repurpose streets for pedestrians, bikes and outdoor dining as part of COVID-19 initiatives and think about how their transport systems will look in the wake of the pandemic, they are also turning to data to assess the impact of decisions at a deeper level.
In March, on top of dealing with the COVID-19 crisis, Seattle’s Department of Transportation (SDOT) was forced to suddenly close the West Seattle Bridge – a key access route for 84,000 residents – to all vehicle traffic due to exponential growth in structural cracking. With the bridge expected to be closed until at least 2022 and 82 percent of people getting to and from West Seattle by car, transport planners had to make fast decisions to ensure residents can continue to move safely despite the lane reduction.
The city is targeting reducing single-occupancy vehicles in the West Seattle area to a maximum of 35 percent of trips. One strategy to achieve this is boosting cycle trips to 10 percent.
Using the Remix platform, which pulls in demographic, operational, ridership, origin-destination data, and other custom datasets, to show how changes in infrastructure could affect the city overall as well as communities, SDOT visualised over 100 active transportation ideas from staff and community groups and cross-referenced them with the existing bike network and in-progress programmes. This allowed them to prioritise infrastructure updates and other initiatives in order to meet their modal goals without having negative knock-on impacts elsewhere. Actions included installing new traffic monitors and travel time displays, reducing speed limits, adding rapid transit lanes and bike infrastructure, and closing some streets to cars.
“It’s not just a question of the fact that geometrically the same number of vehicles is not viable; it’s also a question of environmental justice,” said Heather Marx, Director of Downtown Mobility, SDOT, noting that the main detour routes lead into several Duwamish Valley neighbourhoods which already have high levels of air pollution, and this must not be exacerbated.
She added that modelling the proposals “enabled us to identify projects that not only could drive that 10 percent modal split, but also the projects that were going to be the most beneficial to communities of colour, so that we could make sure that the benefits of active transportation were being equitably distributed.”
Cultural transformation
In another example, in April, the San Francisco Municipal Transportation Agency cut service on 89 bus lines down to just 17 to reduce COVID-19 risks to staff and the public (some are now operational again but several remain suspended). The Remix platform helped the agency understand which were the “workhorse lines” with high ridership and used by essential workers, and which were less critical, relatively speaking, and could therefore be paused.
Tiffany Chu, CEO and Co-founder, Remix, noted that although the exercise was still highly challenging, it would have typically taken months but was achieved in days: “Right now, everything we’ve ever learned about efficiently moving people in as little space as possible has been turned on its head. What we are seeing is that cities are planning and implementing projects faster than ever before, and that takes a different mindset, approach and culture, as well as a different set of tools to enable that.”
As micromobility increasingly becomes part of the fabric of city transportation systems, several roundtable attendees also highlighted how they’re adopting and using tools such as the Mobility Data Specification (MDS) to track not only how many scooters are operating and that they’re being parked safely but also, increasingly, to verify whether they are being deployed equitably across neighbourhoods.
These examples highlight how cities can use mobility data to not only get people from A to B, avoid congestion and improve air quality but also to design transport systems which better serve communities’ unique needs.
As one roundtable delegate put it: “Alongside data, more than ever it is going to be about talking and engaging with the community about what they actually need – it could be the businesses, community organisations or modal activist groups. Those discussions need to be much more articulated as we move forward.”


