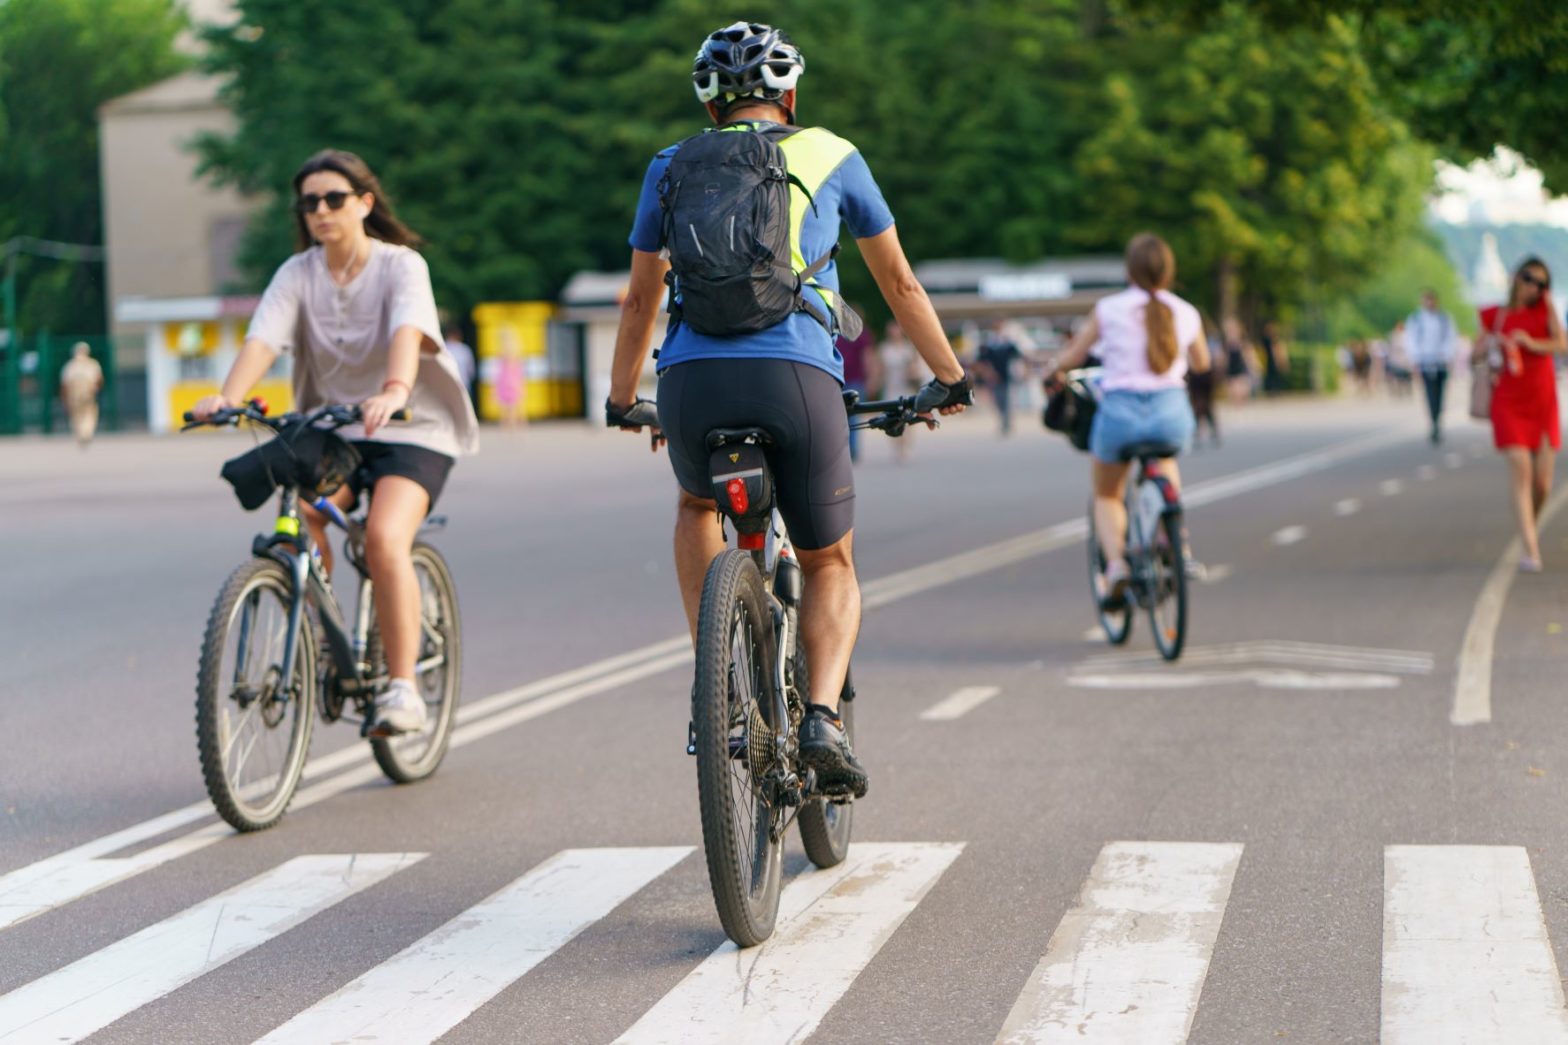
Photo: Shutterstock
How Utah is building family-friendly bike infrastructure
29 August 2022
Sponsored by: Streetlight Data
In 2017, Utah’s then-Governor Gary Herbert launched an aggressive campaign to build 1,000 miles of family-friendly bike paths, lanes, and trails across the state over ten years. The Governor tapped Bike Utah, a bicycle advocacy group, to spearhead the 1000 Miles Project.
As Program Director for the project, Chris Wiltsie set out to define precisely what “family-friendly” actually meant. With a small daughter of his own, Wiltsie personally understood why parents were uncomfortable bringing their children biking on busy roads – even roads with bike lanes. For street biking to be safe for everyone, he knew considerable infrastructure changes were needed.
With that in mind, Wiltsie and his team developed a planning model to categorise every road in a city, to decide what types of infrastructure and bike facility investment belonged on what types of roadways. His model divided up city streets (based on existing guidelines from the Federal Highway Administration) into one of three categories:
Slowest, neighbourhood byways. 0-25 mph. Bikes are riding on the street with cars. Traffic calming measures such as bulb-outs and reinforced speed limits are recommended.
Middle-range, city roads. 26-44 mph. Bikes are in a physically protected lane using kerbs, bollards, or a parking lane.
Fastest roads. 45+ mph highways. Bikes are on multi-use paths separated by at least a medium or grade separation. Large mediums can also have trees.
The model was aimed at standardising the amount of separation bikers should have from vehicles based on the speed of the vehicles. Wiltsie felt this model was sound, but it needed to be tested. Enter Provo, Utah.
Provo city data on bicycle usage
To help validate his bike infrastructure guidelines, Wiltsie reached out to one of the state’s most vibrant local advocacy groups, Bike Walk Provo. Through this relationship, which came with access to transportation data analytics company StreetLight Data, Wiltsie was able to view the complete picture of Provo’s bicycle activity, study Provo city streets, and test his model. He analysed vehicle speed, AADT (annual averagedaily traffic), and O-D (Origin-Destination) metrics from every corner of the city.
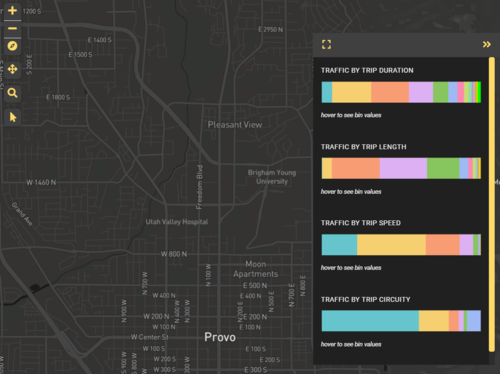
Wiltsie viewed bicycle activity in a way he hadn’t experienced before. He could detect precisely where the bicycle-specific traffic volume was greatest as well as how the volume fluctuated throughout the day. This was incredibly useful. But it was the Origin-Destination analysis of bicycle trips, that brought him a more complete picture. Wiltsie learned that the purpose for half of all cycling trips was not – as many planners assumed – purely recreational. He found that in fact: “Data showed people riding very short distances at slow speeds to locations that match the time of day and locations that people normally are getting around in cars.”
Wiltsie was surprised to obtain such clear, visual evidence that Provo residents are relying on bikes more and more for ordinary, daily activities. Instead of bicycling being driven by pure recreation, they were actually happening just as often in the busier, city centre. This would have huge implications on where planners should consider building infrastructure.
Following the Provo study, Wiltsie – using StreetLight InSight – discovered that the same commute-driven bicycling was happening in other Utah cities of different sizes. From the suburb of Orem to rural Springville he found that often, half of all riding was occurring in the downtown core.
“People aren’t riding just for sport, fun, or exercise,” he says, “cycling is just how they are commuting”.
A “game-changer” for transportation planning
Through his work with Bike Utah and StreetLight, Wiltsie found that the path to obtaining valuable traffic metrics such as AADT and Origin-Destination data, was far quicker, easier, and more comprehensive than he’d ever experienced in the past.
“StreetLight is a game-changer,” he said. “It gives you the tools to function at a higher level. We’ve always had a lot of data for vehicular traffic, but we didn’t have data for every mode of transportation.”
Wiltsie was also impressed with how advanced analytics enables cities to plan for the future. “It’s a balancing act,” he commented. “Although today it might seem that larger, heavier, facility investments aren’t warranted, if you’re planning for a more family-friendly, safe future, the investment might very well be warranted. You need to plan for tomorrow not for what is happening right now.”
Sean Co, Director of Special Projects at StreetLight, also finds that building infrastructure not only eases safety concerns for today’s cyclists, it also encourages greater usage for tomorrow. He says that large-scale studies all point to the same conclusion, “More investment in these types of separated facilities really encourages people to get out of their cars and ride their bikes.”
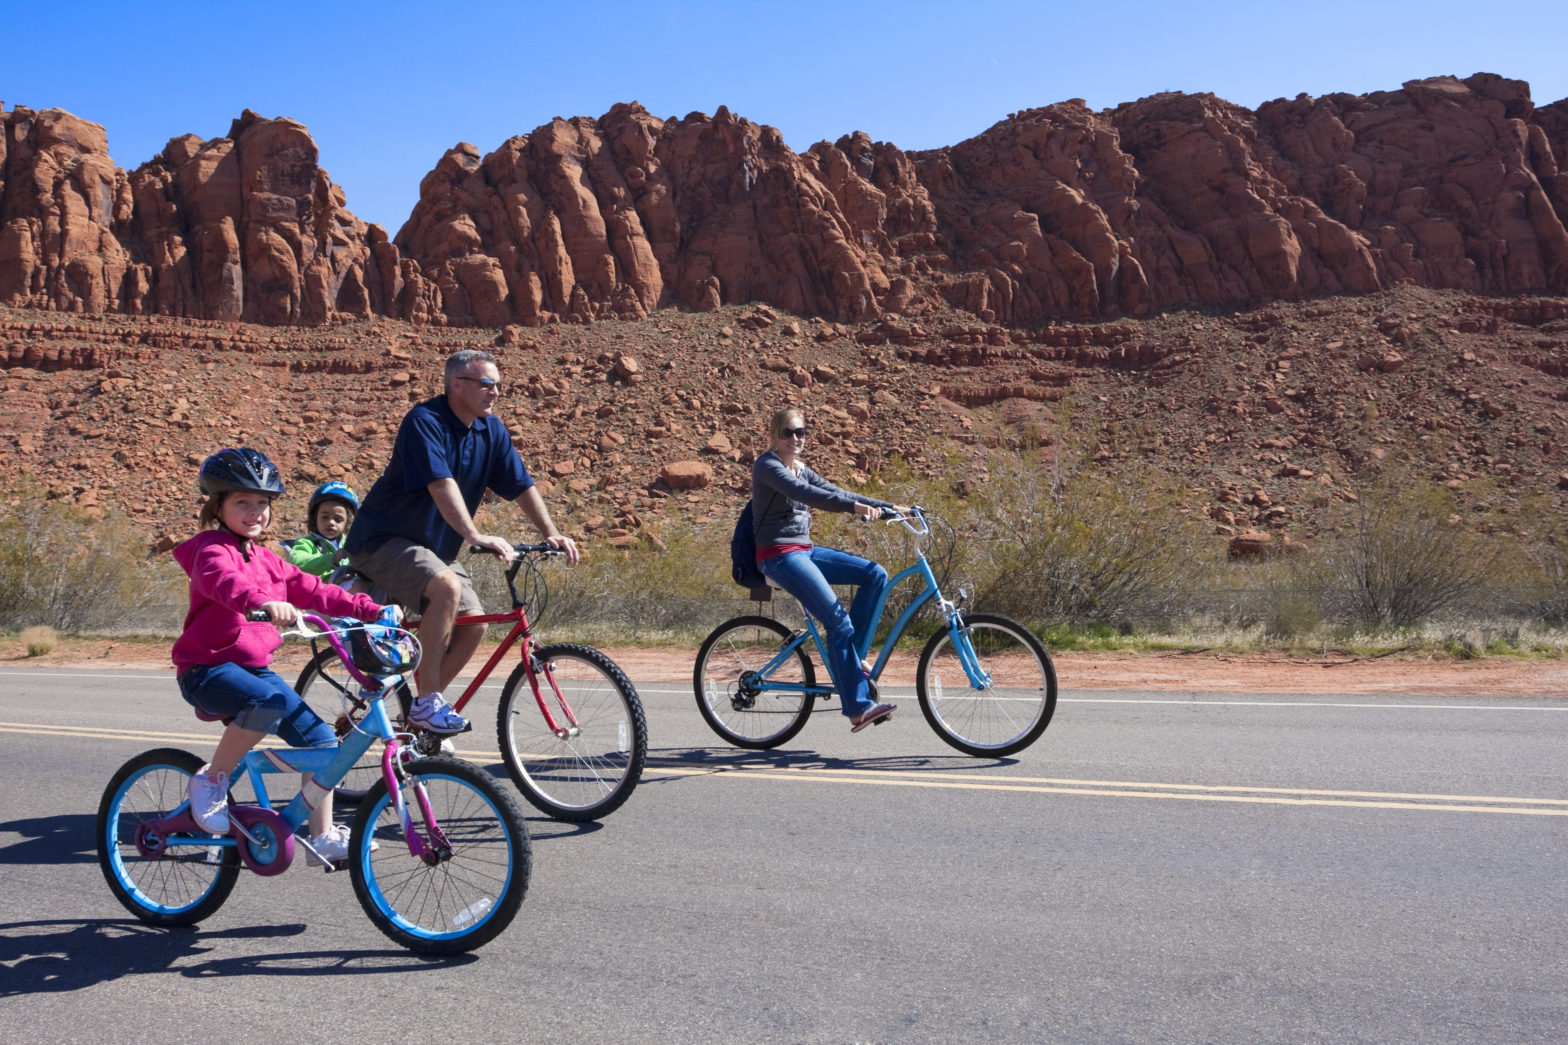
Today, the Bike Utah infrastructure planning model is being used all over Utah to help plan new infrastructure and bicycle facilities. Utah is on its way to fulfilling the 1,000-mile goal and elevating the comfort level for riders of all ages to safely bike to local destinations such as work, school, parks, church, and businesses.
Interested in learning more about how bicycle metrics inform safe infrastructure? View StreetLight’s Bicycle Volume Methodology and Validation Whitepaper