Photo: shutterstock_1773306470
How Pittsburgh uses big data to make streets safer for all
25 May 2022
Any city planner will tell you that safety for all residents is one of the highest – if not the highest – transportation priority.
But spotting and reducing trouble spots, such as high crash zones, requires a fully comprehensive picture of both current and historical traffic data.
To see how equitable a city’s safety record is, requires demographics to be interlinked with traffic patterns. Until recently, obtaining these insights with a high degree of confidence has been nearly impossible.
For decades, cities have gathered traffic data by manually placing counters in high traffic areas. But this method is far from ideal. It’s slow, expensive, requires maintenance (which can be physically dangerous), yields a low and often unrepresentative sample size, and it’s mostly limited to high volume corridors. It just doesn’t offer an equitable view of the city.
Planners don’t know who’s being harmed by speeding or where cars are dangerously cutting through residential neighbourhoods. They need a reliable, efficient way to see precisely what leads to spikes in crashes that affect pedestrians, bicyclists, and cars everywhere.
And it isn’t just cities pushing safety. Federal programmes such as the Safe Streets and Roads for All Grant Program (SS4A) – sprung from the recent infrastructure bill – are offering aid to cities that are conducting, planning, designing, and developing safety initiatives. Access to funds requires a data-driven, strategic approach with demonstrated adherence to safety and equity mandates.
Pittsburgh is a great example. The city is actively moving to improve safety for their region, with planners using advanced analytics to discover and rank trouble spots to best prioritise investment.
Making ‘Steeltown’ safe and equitable
During the pandemic, Pittsburgh’s Department of Mobility and Infrastructure (DOMI) began an initiative to build safer and more equitable transportation infrastructure. DOMI was striving for safety in mobility no matter what mode of transportation city residents and visitors use.
Planners wanted to create new initiatives for pedestrians, bicyclists, and of course automobiles, on 1300 miles of city streets – without leaving any residents behind.
Where are crashes happening?
DOMI needed information about Pittsburgh’s most vulnerable traffic corridors.
They worked with StreetLight to isolate – for the first time – bicycle and pedestrian metrics specifically. The StreetLight InSight® platform captured Origin-Destination (O-D) Metrics to help planners answer questions like:
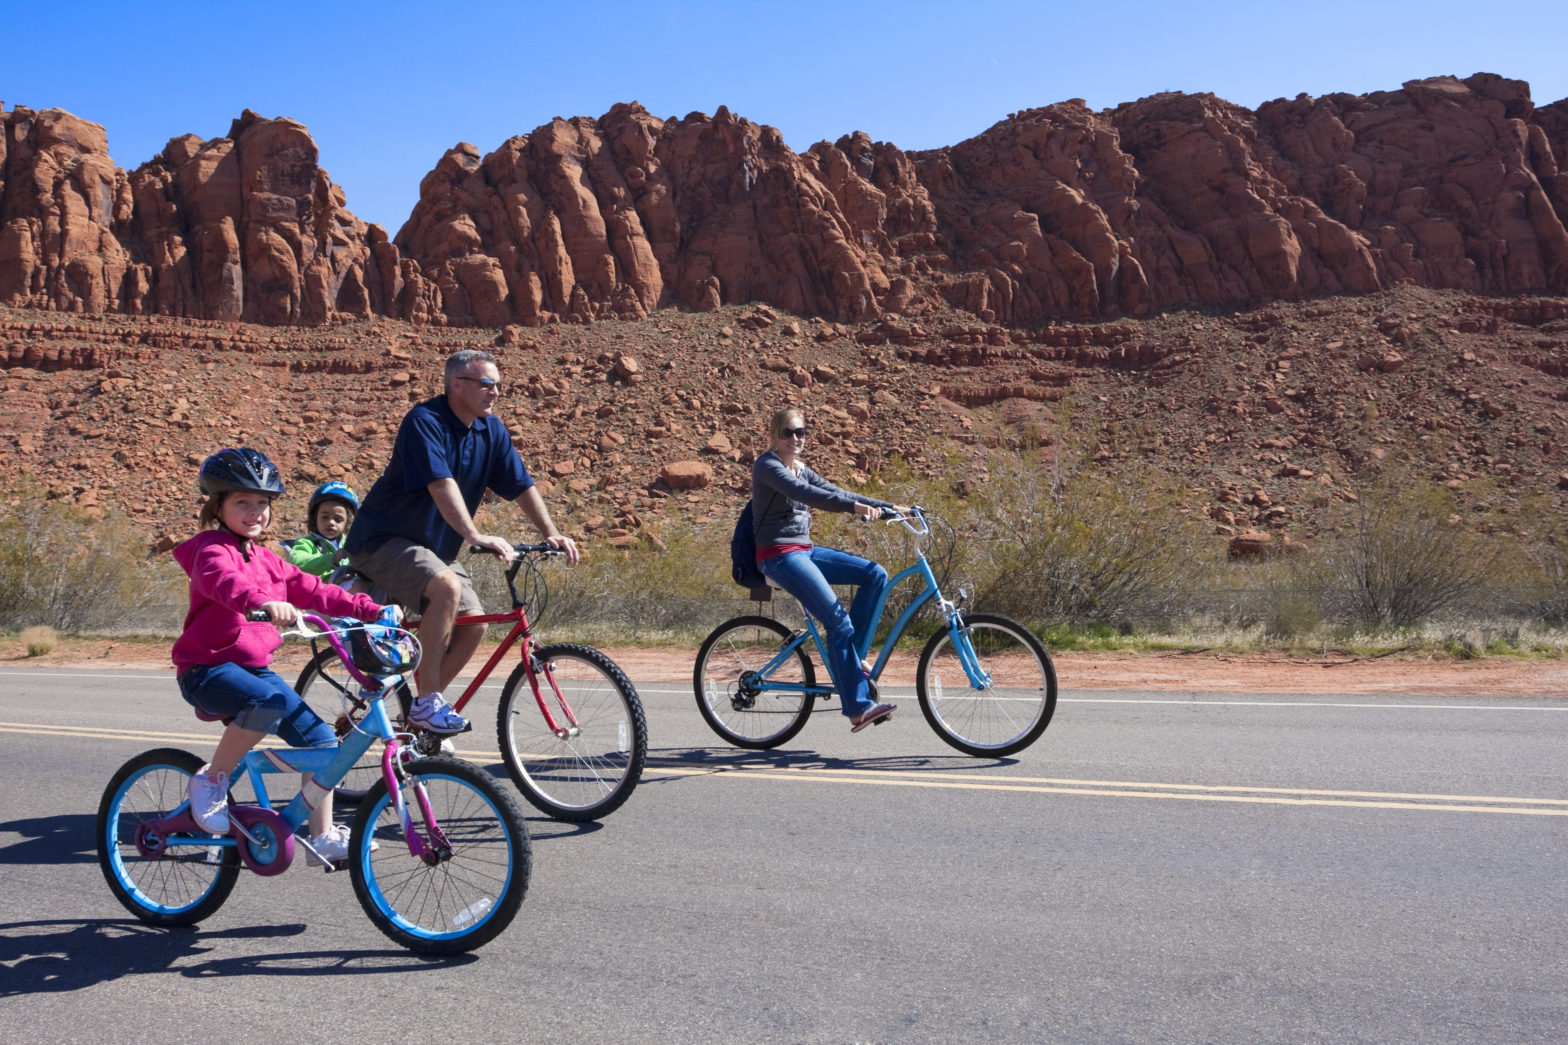
- Bicycle and pedestrian travel patterns
- When and how long bikers/walkers are travelling
- Seasonal shifts in biking/walking
- Demographic information
- Volumes at intersections (for signal timing)
- Where and why crashes were occurring
With O-D metrics, planners were able to measure traffic activity by looking at average trip distance to and from all key city neighbourhoods. They then overlaid those metrics with years of bicycle and pedestrian crash data (2015-2019) to see how activity correlated with safety.
Since biking and pedestrian activity drops during Pennsylvania’s chilly winters, analysts took seasonality into account and they created an overall metric for both Bicycle Miles Travelled (BMT) and Pedestrian Miles Travelled (PMT) based on the months of April-September in 2019 and 2020.
Low volume areas
Planners were assuming that bike and pedestrian crashes were happening in popular, high travel spots such as shopping, commercial, and school corridors – but actually the most severe crashes occurred in areas with lower bike and pedestrian traffic.
Half of all fatal crashes involving pedestrians (half of total crashes) happened in low pedestrian activity neighbourhoods. Half of all fatal crashes involving bicycles (just over a third of total crashes) occurred in neighbourhoods with low biking activity and little or no bike infrastructure.
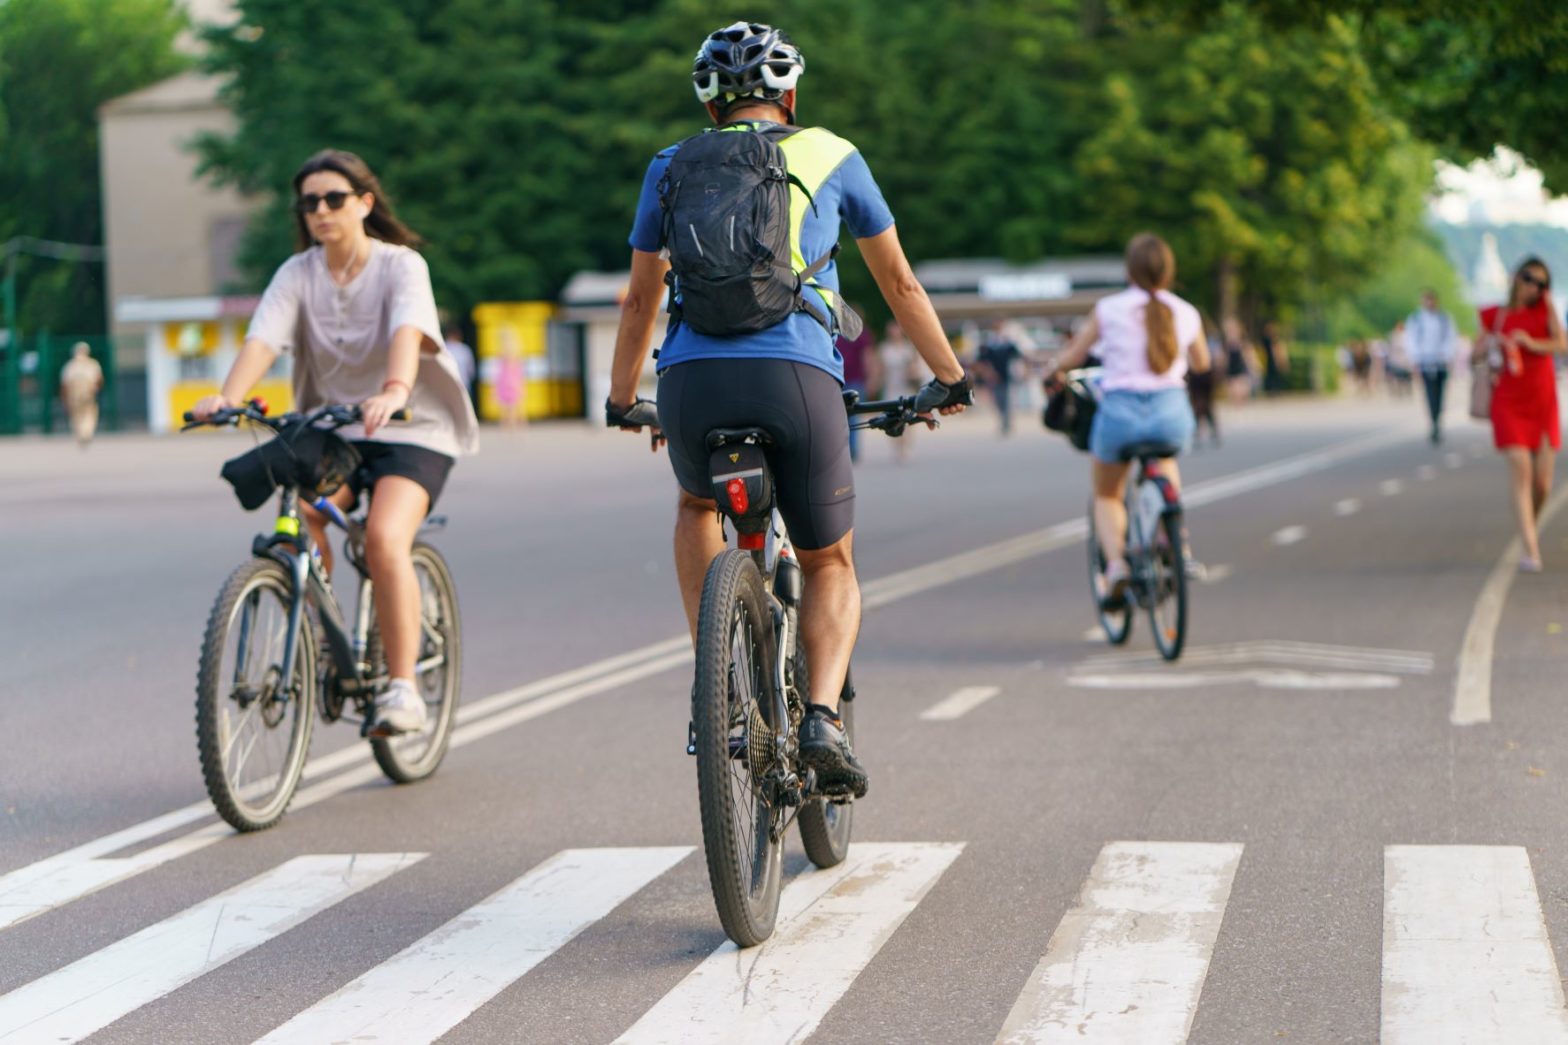
Metrics also revealed the causes of these crashes. Turning movement counts showed specific corners with both high traffic volume and speeding were common crash sites. They could also immediately confirm a higher frequency of crashes were happening at night as well as at the most dangerous crosswalks.
These findings helped Pittsburgh implement a myriad of new multi-modal safety initiatives.
Senior Transportation Planner Panini Chowdhury said StreetLight InSight® made multimodal data collection much richer, more efficient, and more complete. “The automated way these metrics are gathered and how we now visualise different modes of travel is a lot faster than manually counting traffic.
“It lets you slice-and-dice bike, pedestrian, and vehicle data in so many different ways.”
Full equity picture
Antonio Gittens, Solutions Engineer at StreetLight, points out that transportation analytics must be representative of everyone.
Metrics derived on StreetLight InSight® come largely from (anonymised) smartphones. “We know our Metrics are representative because smartphone penetration is in a diverse majority of the population. We always internally compare our analytics against census data to ensure we’ve accurately captured a representative sample reflective of all communities.”
Safety measures
Metrics in hand, Chowdhury and other planners began designing safer and more equitable infrastructure. They built more bike parking for business districts with high bicycle activity. At dangerous intersections or travel corridors, they implemented traffic-slowing measures such as narrowing lanes, speed humps, and painted ‘sharrows’. Dimly lit streets were given brighter, LED lighting.
As Pittsburgh discovered, real-world mobility data is crucial to get the full picture on safety and equity, and prioritise areas that are lacking. US cities are using transportation analytics to tackle common goals such as:
- Complete Streets. Obtaining vehicle/bicycle/pedestrian usage patterns on traffic corridors, inform a redesign which prioritises non-vehicle modes.
- Safety/Vision Zero. Recording segment speeds and volumes for bicycles and vehicles to help cities prioritise safety interventions for vulnerable users and exposure mapping.
- Accessibility/Equity. Evaluating traffic volume around business districts/transit centres/public facilities to determine where access can be improved.
Safety and equity are a top concern for cities in the US and all over the world. More and more city planners are moving away from manually implemented, spotty traffic counters. Instead they’re relying on advanced, instant-access analytics. Traffic impact studies are thereby thorough, covering every street and neighbourhood in the region. High-risk areas are quickly identified and prioritised for investment, paving the way for safe, equitable, multimodal travel for all.
Discover how the City of Pittsburgh made 1,300 miles of core city streets safer for pedestrians and cyclists by combining bike and pedestrian transportation analytics with traffic-related crash data. Download the case study here.