

Photo: Ecosystem Informatics
Charting cleaner cities: The versatile role of air quality data
21 September 2023
The United Nations predicts that up to 2.5 billion more people will be living in cities by 2050. As the total area covered by cities grows and more people move to urban settlements, cities face threats to quality of life, including pollution and climate change. City authorities are racing to act quickly to invest in the right infrastructure and technology to better manage greenhouse gas (GHG) emissions, urban development, mobility, resources, and public safety. Governments around the world are increasingly relying on air quality and GHG emission monitoring systems for data.
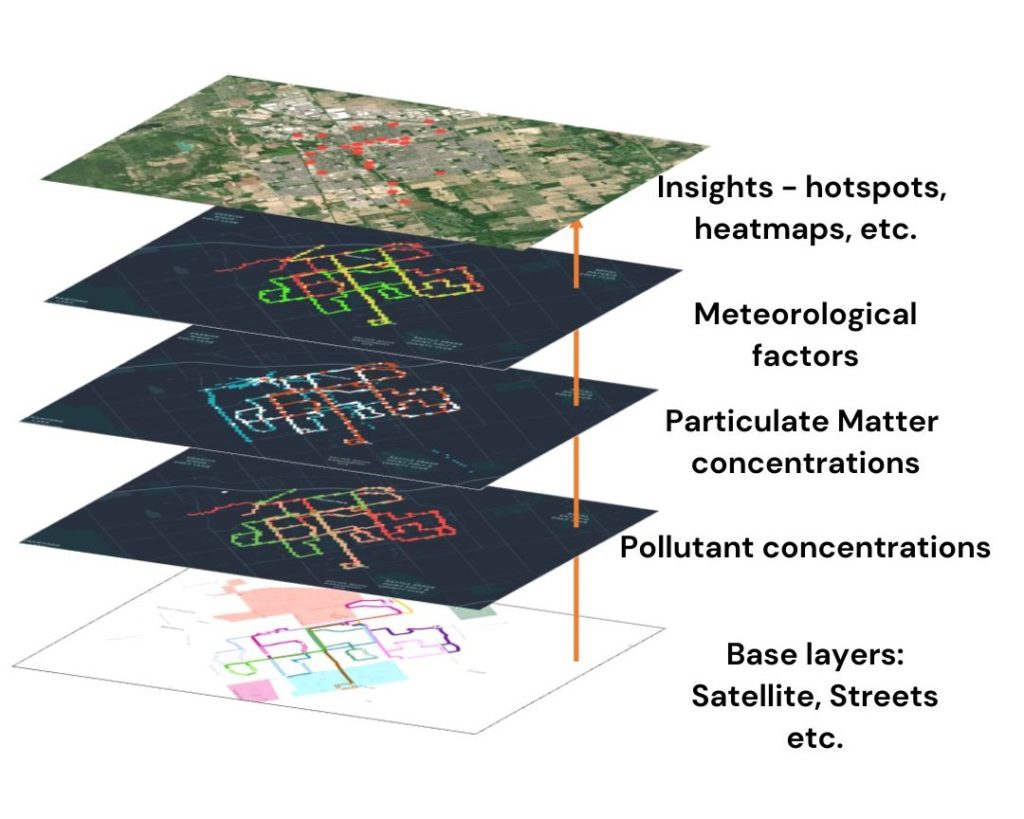
This is where companies such as Ecosystem Informatics Inc. (ESI) come in. ESI is a company based in Ontario, Canada that focuses on technology and data. ESI’s unique monitoring system collects, analyzes, and presents air quality data as insights in an easy-to-use web-based dashboard to support decision making. Using proprietary AI algorithms, ESI is the world’s first truly mobile air quality monitor, which reaches a geographic coverage ten times larger than other devices, in a more cost-effective way. For growing cities, the applications of this data are versatile and far beyond traditional use as an index for the public to view.
Smart cities
As technology transforms urban centers into smart cities, local governments depend on air quality monitoring to ensure public safety and environmental conservation. ESI’s systems are implemented around the world in large regions such as Hyderabad, India, British Columbia and Ontario, Canada, and Tallinn, Estonia. ESI systems are used for planning sustainable projects such as the electrification of public buses. The units are easily installed on any stationary or moving platform, such as the exterior and interior of active buses, cars, pre-existing buildings, fences, and poles without the need for special infrastructure to operate. These sensors then collect the baseline data needed for scenario modeling, such as predicting the potential impacts of implementing electric buses or other transportation network plans. Without access to this insightful and predictive data, local governments cannot properly plan, execute, and justify such large-scale projects.
Governments also need data and analytical tools to track the progress of these green initiatives. Measurable goals can be set and monitored by viewing real-time and historical pollutant levels in the form of visual trends, heat maps, and charts. These tools are needed to identify areas of concern and major sources of pollution. Air quality and GHG data and scenario modeling is also vital for efficient transportation and infrastructure planning, as it empowers cities to predict the impact of all potential projects including road expansions, industrial builds, conservation efforts, land use, zoning, and choosing locations of schools, parks, and residential areas.
This same data and modelling can be used by departments concerned with urban development, technology, tourism, policy advocacy and conservation, agriculture, financial planning, research and development, geological leak detection, regulation compliance, risk assessments, air monitoring in hospitals and public schools, and public awareness. Examples include using ESI units to record data on temperature and pollution levels for agricultural use or using data for public awareness to inspire residents to make sustainable choices.
Public safety and emergency procedures
It is crucial for local governments to use air quality data for public safety and emergency alert systems. Cities utilize real-time block-by-block air quality data so that residents can plan activities and protect their health during periods of poor air quality. This is especially relevant in the summer months when forest fires are most likely to occur. Communities in forest fire impact zones can use the ESI dashboard to set up early warning systems that automatically alert authorities of vulnerable areas and hotspots, or when levels of smoke increase. These alerts and the accompanying data aid authorities in announcing evacuation plans before a situation turns deadly. Access to real-time data aids first responders in emergencies by supplying information needed for route planning, resource allocation, resource requests, and safety equipment deployment. This data is also needed to assess and plan remediation efforts in the affected areas.
ESI’s web-based browser is also necessary for public safety in an industrial and construction context. Manufacturing plants and construction sites contribute to pollution in the form of particulate matter, carbon monoxide, and other gases that pose a threat to human health. By installing ESI monitors inside and outside of these workplaces, managers can track the levels of pollution their employees are exposed to and set up alert systems to detect when pollutants are approaching dangerous levels. This data aids managers in making informed decisions about employee safety equipment and the use of ventilation systems. It also allows managers to identify which activities or machines contribute the most pollution, so they can schedule these activities accordingly and repair or replace faulty equipment. Identifying faulty equipment also saves money by improving energy efficiency. Not only is this all crucial for employee safety, but managers can track pollution levels over time to ensure all environmental regulations are met. And finally, akin to goal tracking by governments, companies can use the dashboard to set and track emissions reduction goals.
City planning and public safety are two major topics of interest, but the technology of ESI can service a wide variety of projects, from risk management for the oil and gas industry and leak detection, to monitoring farm health in agricultural contexts. The uses of air quality data are truly endless.
Interested in learning more? Visit ecosinfo.ca
Brought to you by:
![]()
