
Photo: cody-lannom-unsplash
Wary of speeding, Nashville is using big data to make biking safer
10 June 2022
Fewer cars must mean safer streets for cyclists, right?
Apparently not. Cities all over the US recently discovered that when traffic waned during the pandemic, drivers responded by hitting the gas. Speeding became worse than before.
At the same time, home-bound folks turned to cycling as a covid-safe way to exercise and commute. But of course, speeding vehicles and cyclists don’t mix.
Counterintuitively, roads became more dangerous during the pandemic.
Fewer cars, less danger?
Nashville, Tennessee, in particular was determined to get ahead of this deadly situation and keep citizens safe. They began an investigation into precisely where the most dangerous hotspots were in order to design and implement meaningful solutions. With normal data collection methods impossible due to stay-at-home orders, Big Data was the only solution for collecting this information at scale.
In the thick of the pandemic, Nashville’s biking and pedestrian advocacy group, Walk Bike Nashville (WBN), began to hear complaints from residents about cars speeding through neighbourhoods.
WBN Executive Director Nora Kern believes that driver behaviour wasn’t the only problem. “The amount that speeding increased due to reduced traffic volume after the first wave of COVID-19 was surprising,” said Kern. “It emphasises the fact that our streets trigger this behaviour, and that more work needs to be done to incorporate traffic calming and other infrastructure improvements to make streets safer for all.”
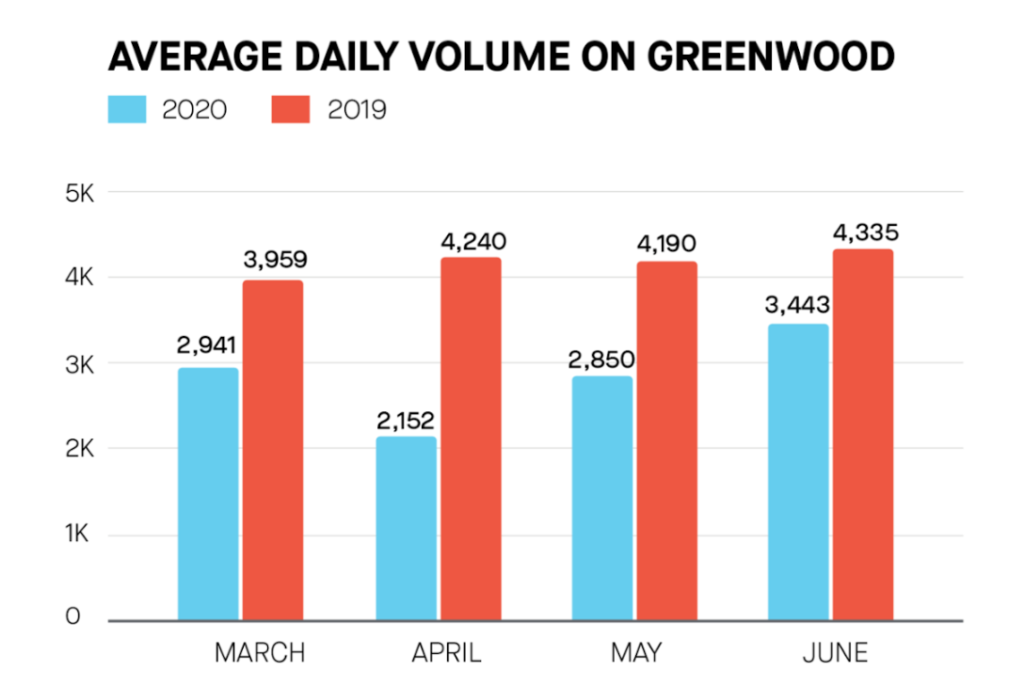
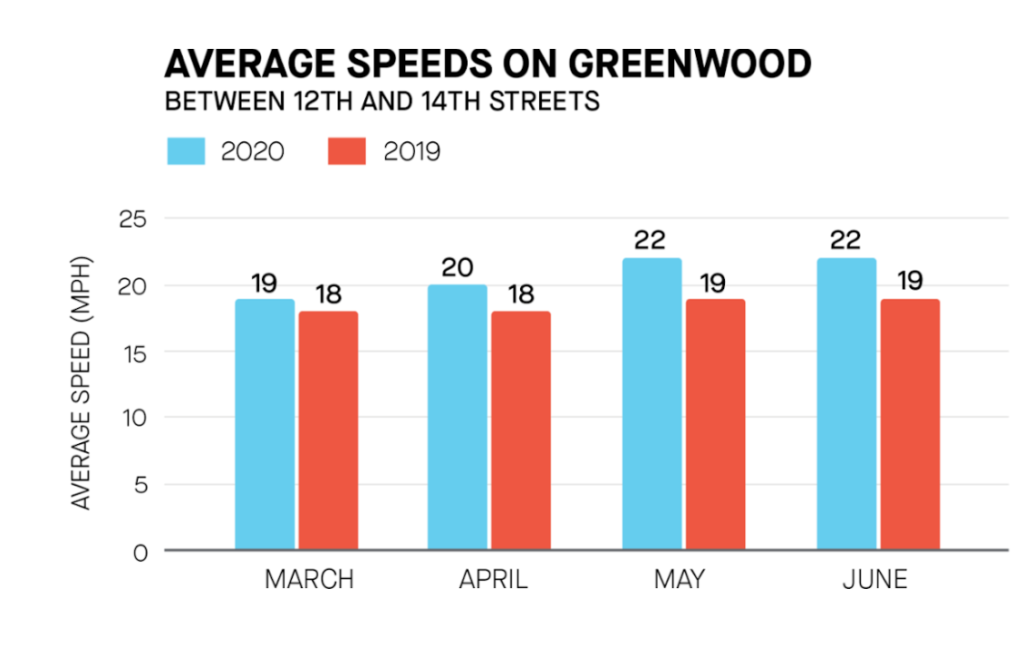
Taking residents’ concerns seriously, WBN began an analysis of traffic volume and speed on Greenwood Avenue in Nashville. Analysts compared the months of March-June of 2019 with March-June of 2020. StreetLight’s transportation analytics and visualisation tool StreetLight InSight® enabled this analysis without having to send staff into the field during the pandemic. Lo and behold, residents weren’t imagining the rampant speeding. Despite spring traffic being down between 20-50 percent in 2020 from 2019, average speeds were up.
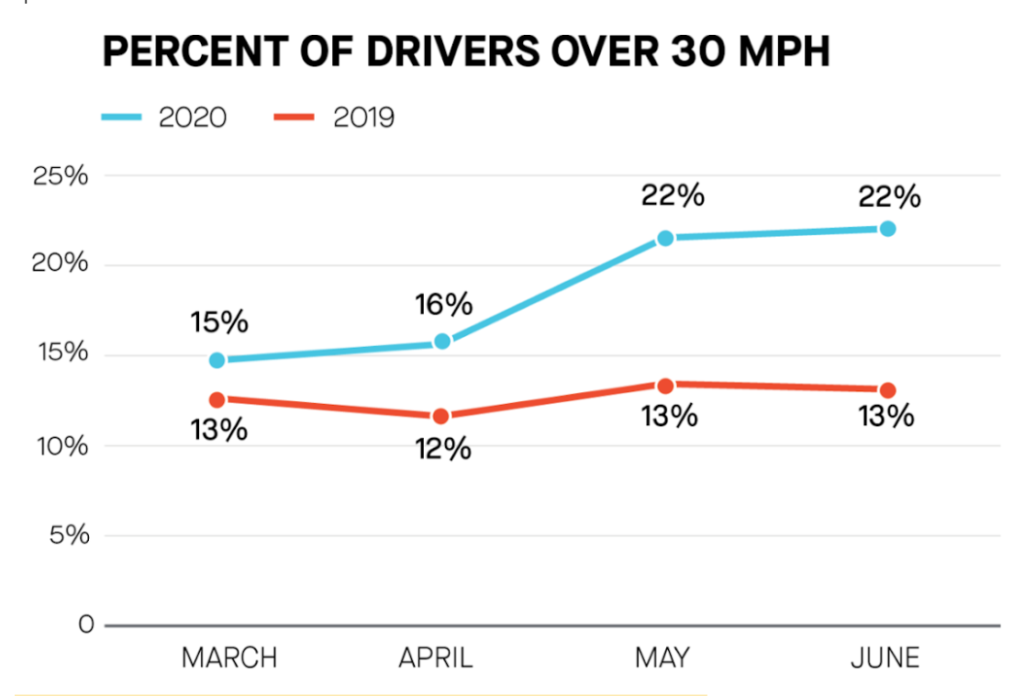
And unsurprisingly, with the emptier roads, nearly a quarter of all drivers were over the 30 mph speed limit.
Metrics offered supportive evidence for new safety measures
Walk Bike Nashville is a long-term advocate for safer walking and biking in their city. Getting ahold of these concrete road safety numbers was what they needed to advocate for more safety measures. “We were very grateful to be able to validate the residents’ concerns and bring attention to this critical issue,” added Kerns.
“It’s clear, the faster someone is driving the more likely they are to kill someone in a crash.”
WBA has since made recommendations to Nashville transportation planners to manage speed through improved infrastructure such as traffic calming, narrowed car lanes, wider sidewalks/bike lanes, and other street-engineering techniques. The city has also put in place a new Vision Zero programme.
Streetlight’s Director of Special Projects Sean Co worked with WBN. Co says, “Pandemic-generated speeding brought dangerous changes to the East Nashville urban environment. StreetLight InSight® provided WBN analytics that would have taken months to collect using traditional methods. Mobility data bolstered their traffic calming recommendations to permanently reduce speed and increase safety for walkers and bikers in the area.
“Advanced transportation analytics make cities more resilient to changes in urban mobility, keeping their environments safer and healthier.”
How to make biking and walking safer
Nashville is not alone.
Speeding and reckless driving, which puts cyclists and walkers in danger, happens everywhere. Cities want safer streets and safer streets start with understanding local mobility patterns. Advanced transportation analytics offers vehicular data such as speed, traffic volume, top trip destinations, and peak traffic hours. To get an even better handle on safety, that analysis can be overlaid with specific bicycle and pedestrian metrics such as:
- Bicycle and pedestrian activity on nearly every road, lane, or trail
- Origin-Destination (O-D) data for bicycles and pedestrians
- Zones with the most cycling activity
- Education, income level, and other demographics to ensure infrastructure investment is equitable
- Trip speed, travel time, and more
Obtaining a full, multi-modal picture of what is happening on local streets helps planners justify and prioritise traffic calming initiatives like speed bumps, street narrowing, and better biking/walking infrastructure.
Historically, collecting traffic data has been time-consuming and limited – especially on local roads – and cycling data near-impossible. Today, data gathering is quick, automated, and reaches every last road no matter how rural. Transportation planners can even go years back to see specific changes in activity over time. They save tremendous time and resources by obtaining data with a few clicks of a mouse, getting access to incredibly specific metrics, broken down into different modes of travel such as private vehicles, bicycles, buses, commercial, scooters, and pedestrians.
Safety is top of the transportation agenda
Cities are using these enhanced mobility analytics to design all kinds of infrastructure updates but ultimately, improving safety is usually the top transportation priority. Guided by initiatives such as Vision Zero (a programme to eliminate traffic fatalities through proactive safety measures), transportation analysts can pinpoint high-risk zones and gain a clear understanding of multimodal travel behaviour including bike and pedestrian Origin-Destination data, traffic volumes, and speeds for corridor safety assessments. Safety initiatives can be tested for equity (another top priority) by layering demographic data on top of traffic metrics. The effectiveness of safety initiatives can then be tested with Before-and-After studies.
The rise of active transportation is a boon to US cities for reasons as varied as health, climate, and economical impact. But safety must keep up. Transportation analytics are a powerful tool for public works officials and planners to design safe and equitable infrastructure for all.
Curious to learn more about obtaining safety data for your city? Check out this webinar: From Speeding to Bike Safety.