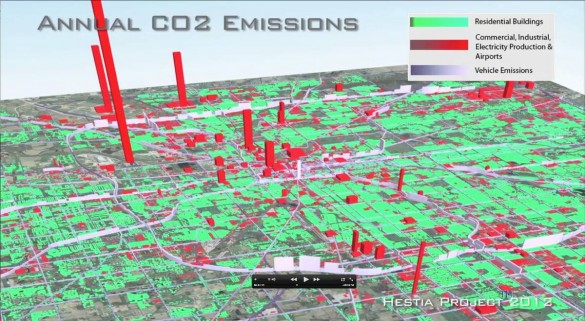
Photo: hestia
Three-dimensional maps reveal carbon footprints for buildings and streets
12 October 2012
by Richard Forster
New software will allow cities to picture how much greenhouse gas emissions they are releasing and enable them to pinpoint the worst offenders by zooming in on specific buildings and roads.
The technology, developed by Arizona State University, USA, enables cities to ‘see’ their C02 emissions which previously could only be quantified at a much broader level. Named Hestia–after the Greek goddess of hearth and home–the program collates data from extensive public sources, including local air pollution reports, traffic counts, age of buildings, factories and power plants, and rolls this into a modelling system.
“Cities have had little information with which to guide reductions in greenhouse gas emissions–and you can’t reduce what you can’t measure,” said Kevin Gurney, lead scientist from the Hestia program and associate professor at Arizona State University. “With Hestia, we can provide cities with a complete, three-dimensional picture of where, when and how CO2 emissions are occurring.”
In addition to helping citizens visualise greenhouse gas emissions, the researchers hope that the tool will assist city leaders identify where an investment in energy and greenhouse gas savings would have the greatest impact.
“These results may also help overcome current barriers to the US joining an international climate change treaty,” said Gurney. “Many countries are unwilling to sign a treaty when greenhouse gas emission reductions cannot be independently identified.”
Currently the scientists have mapped the US city of Indianapolis, but are working with Los Angeles and Phoenix, and are looking to expand to other US cities.
Gurney told Cities Today that expansion into other cities is one of the next priorities, where costs of the program, although not finalised, would be between US$50,000 to US$75,000, for US cities. “We want to build the system from a baseline type of information to one that can field queries like, ‘What happens if I insulate this part of the city?’. We also want to move to a web 2.0 platform concept where citizens can have their utility billing information routed to us on a voluntary basis. This would be powerful.”
Importantly the maps and three-dimensional images can be analysed at specific times of the day and how the rates fluctuate and rise through summer and winter.
“It is clear to me that de-mystifying emissions and placing them in the readily recognisable landscape of our daily lives could empower people to take action,” Gurney said. “Scientists have spent decades describing the seriousness of climate change. Now, we are offering practical information to help do something about it.”