Photo: Optimized-iStcokphoto.com_-572×380
Is your city measuring up to its responsibilities?
08 November 2012
by Richard Forster
As new technology is unveiled which allows cities to map their emissions in 3D, Andrew Bates looks at the options for city leaders to measure greenhouse gas emissions
With cities increasingly taking centre stage in the sustainable development and prosperity of nations, the need for globally comparable data and knowledge on urban emissions has never been greater. Cities are major producers of the carbon emissions that contribute to climate change. According to the Clinton Foundation, cities are responsible for 75 percent of the greenhouse gases released into our atmosphere. And such greenhouse gas emissions are under the control or influence of local governments since a majority of these emissions are linked to urban buildings, transport and energy consumption.
“The vulnerability of cities to climate change is largely underestimated,” says Patricia McCarney, Director at the Global City Indicators Facility (GCIF) in Toronto. “There is no established nor standardised set of city indicators that measures the effects of climate change on cities and assesses those risks, nor is there a comprehensive set of indicators with a common, accepted methodology designed to measure the impact that cities have on climate change and the role that cities play, for example, in contributing to greenhouse gas emissions.”

In June, Bethlehem became the the 200th city to join the Global City Indicators Facility, which uses a standardised definition and methodology for each indicator that cities are expected to follow when reporting. The indicator for ‘greenhouse gas emissions measured in tonnes per capita’ used by the GCIF is based on existing methodologies of the Intergovernmental Panel on Climate Change and the methodology adopted in ICLEI’s HEAT Software Tool (Harmonised Emissions Analysis Tool). This GCIF indicator measures the total tonnage of greenhouse gases (equivalent carbon dioxide units) generated over the past year by all activities within the city (the numerator) divided by the current city population (the denominator) expressed as a per capita figure.
Being able to measure emissions is vital for city administrators. As New York’s Mayor Michael Bloomberg says—if you cannot measure it, you cannot manage it.
“We don’t know the total amount of greenhouse gases emitted by the world’s major cities, we don’t know the most effective measures for reducing emissions in cities, and we don’t know in detail how warmer temperatures will affect cities,” says Conor Riffle, Head of Cities for the Carbon Disclosure Project.

The Carbon Disclosure Project (CDP) collated data from 73 cities for its 2012 cities report up from 48 cities in 2011. Forty-five of the reporting cities come from the C40 group of 58 cities following a partnership agreed with CDP in 2010. But while the data which is collected through online submissions provides some interesting pointers—for example, cities with defined targets for reducing emissions have three times as many reduction activities as those without such targets—with just 73 cities, there is a very long way to go.
“The state of the world’s knowledge about climate change and the role of cities is in its infancy and we need more and better data about what works and what doesn’t in cities,” says Riffle.
The data reported by Global City Indicators Facility member cities goes through a three-step verification process. This is first carried out internally at the GCIF by in house statisticians; secondly, it is done by GCIF member cities verifying their own and each other’s data; and thirdly, it is performed at the definition and methodology level through third party verification.
But the problem is that information has often been collected using different methodologies, which has led to data being analysed and reported in different ways. And the lack of a universal standardised methodology for devising indicators on climate change at the city level has greatly affected the quality of research, making it difficult to provide comparisons across cities. Of the 22 European cities participating in the Carbon Disclosure Project 2012 report, seven relied on their own self-established standard for reporting and six used the international standard favoured by the International Panel on Climate Change.
“That is why at the recent World Bank meeting in Barcelona there was a lot of talk about the new city protocol idea of bringing together all of the cities and trying to create that kind of uniformity of approach to understanding what priorities are,” says Rosemary Feenan, Director of Global Research Programmes at Jones Lang LaSalle. “All cities are different, but there are themes that connect and clearly some of the basic climate change themes do form a backbone for all of these cities to link into. Climate change data in relation to cities will improve over the next decade but it must be realised that city data is costly. We have to accept that there is a cost, and not just a physical cost, but also in the sensitivity of the data.”
The Global Protocol for Community-scale Greenhouse Gas Emissions announced in May is an important step forward in trying to create that uniformity of approach. The Protocol aims at harmonising emissions measurement and reporting processes for cities of all sizes and geographies. Developed by C40, ICLEI – Local Governments for Sustainability, the World Resources Institute (WRI) and other partners, and launched in May 2012, the Protocol will strengthen efforts for measurable, reportable, verifiable local climate action and help cities to raise the level of ambition of national governments to mitigate climate change. Being piloted in a number of cities the protocol is a standard prescription that advises cities on which emissions source they should include in their inventories and how to do the calculations. The protocol will make the process easier and help cities produce inventories that are comparable to those from other cities.
“Measuring and reporting on a single platform every year is critical to helping humanity understand its cities,” says Riffle.
The impact of new technology
In addition to getting cities to converge on a single standard, technology is also assisting the push to better measurement of urban emissions. Measuring emissions can be a complex task for a city, especially for the first time, but new software, developed in the US by Arizona State University will allow cities to picture how much greenhouse gas emissions they are releasing and enable them to pinpoint the worst offenders by zooming in on specific buildings and roads.
“It is clear to me that de-mystifying emissions and placing them in the readily recognisable landscape of our daily lives could empower people to take action,” says Kevin Gurney, lead scientist from the Hestia Project and Associate Professor at Arizona State University. “Scientists have spent decades describing the seriousness of climate change and now we are offering practical information to help do something about it.”
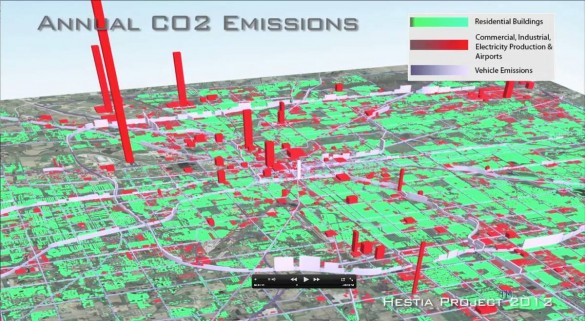
The technology unveiled in October this year enables cities to ‘see’ their C02 emissions, which previously could only be quantified on a much broader level. Named Hestia, after the Greek goddess of hearth and home, the programme collates data from extensive public sources, including local air pollution reports, traffic counts, age of buildings, factories and power plants, and rolls this into a modelling system. The maps and three-dimensional images can be analysed at specific times of the day and show how the rates fluctuate and rise through summer and winter.
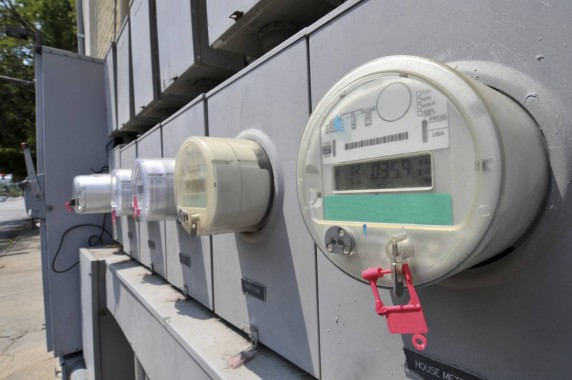
To calculate numbers for individual buildings, the software makes estimates based on the building’s size, age and power source. To check the emissions from particular roads, Hestia taps into traffic and car model data gleaned from vehicle registration records.
“Cities have had little information with which to guide reductions in greenhouse gas emissions, and you can’t reduce what you can’t measure,” says Gurney. “With Hestia, we can provide cities with a complete, three-dimensional picture of where, when and how CO2 emissions are occurring. It is a mixture of measurement and modelling construction.”
Citizen engagement
Another factor which can play an increasingly important role in driving cities to measure and report greenhouse gas emissions is the need to show transparency to citizens. Citizens can play a decisive role in determining whether a city fights climate change successfully. They exercise their primary role at the ballot box, by voting in municipal leaders who champion social and environmental goals. But city governments are also increasingly relying on their citizens to help the city achieve its sustainability goals. Many cities now make city data available via the web, enabling citizens to use apps and programmes that tell the user, for example, how to make the most efficient journey to his or her destination. Research from The Climate Group showed that the number of these web interfaces (called Open APIs) associated with city infrastructure has grown 2,751 percent between 2005 and 2011.
Climate governance is critically important for cities. Citizens play an important role in developing and implementing action around climate change in cities. Improving citizens’ access to information and maintaining a relationship of accountability between local governments and their citizens are critical to improving a city’s climate resilience. Principles of transparency and democracy require that the mechanisms of participation are accessible, easy to understand and with simple forms of representation. Addressing climate change risk in cities depends on the availability and accessibility of information on climate risks and an engaged, informed urban population involved in the formulation of climate action plans.
“Citizen level of engagement is a vital issue,” says Sophie Walker, National Director, Upstream Sustainability Services at Jones Lang LaSalle. “London is one of the leading cities in terms of having clear climate change strategy with strong reduction targets, but that never feeds through to any of the pieces of paper that I get through from the council with my utilities bill or waste expenses. There is never any communication at all about sustainability for anything that I pay for or have voted for so there is a huge missed opportunity in terms of citizen engagement, occurring in one of the cities that is supposed to be leading in this area.”
It takes time, money and effort, to collect the data on emissions so cities need to be smart in finding intelligent ways of communicating what they are trying to achieve in terms of reducing emissions.
It is here that the new 3D software developed at Arizona University can assist city leaders by helping residents visualise greenhouse gas emissions while also helping city officials to identify where an investment in energy and greenhouse gas savings would have the greatest impact. Perhaps the biggest impact will be at national government level.
“These results may also help overcome current barriers to the US joining an international climate change treaty,” said Gurney. “Many countries are unwilling to sign a treaty when greenhouse gas emission reductions cannot be independently identified.”
The collection of data relating to cities and climate change is still in its infancy but to tackle climate change, more mayors must assume the responsibility to connect, coordinate and share information.
“We should not be afraid of the growing number of facilities and projects that relate to cities,” says Conor Riffle. “Instead, we should welcome the explosion of interest in and dedication of resources to helping the world understand cities and how they work. Cities are far too complex to be distilled to a single indicator but we need data that covers the whole range of complexity, in addition to providing context.”