
Google Earth adds global cycling data layer
05 May 2026
by William Thorpe
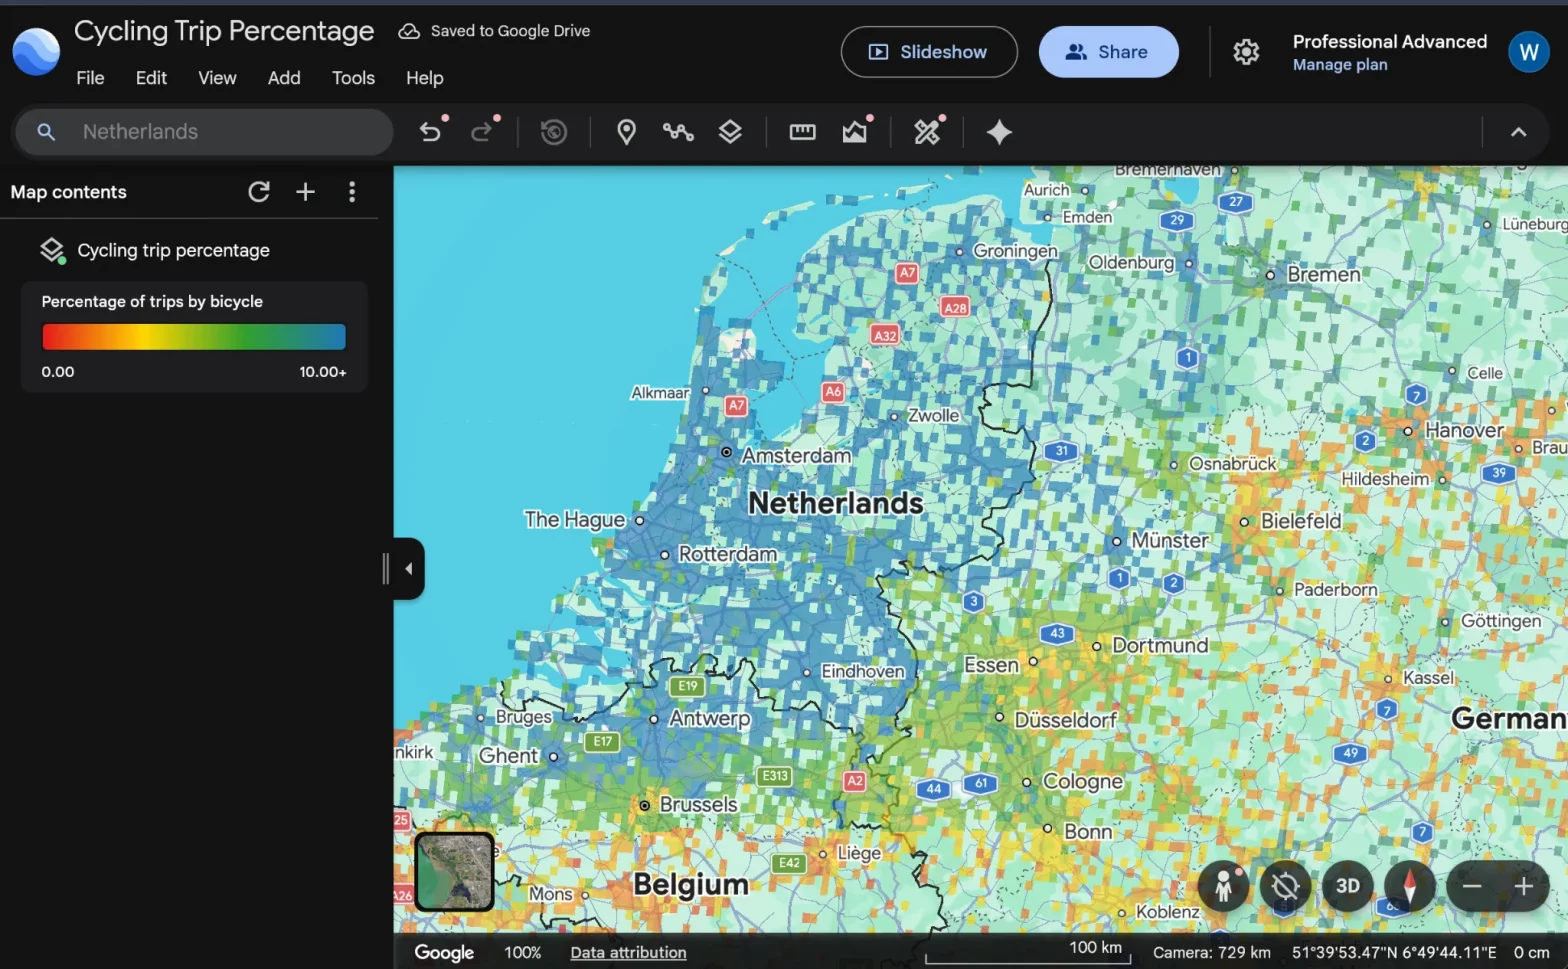
Google Earth has launched a new data layer showing how much of a city’s travel is completed by bicycle, offering urban planners a new way to visualise cycling patterns at neighbourhood level.
The ‘cycling trip percentage’ layer, released in April, maps the proportion of trip segments made by bike within grid cells of roughly 20 square kilometres. The dataset, currently based on December 2025 activity, draws on aggregated Google Maps trend data and is now available globally through the platform.
The tool is designed to help planners prioritise cycling investment by making patterns more visible and intuitive. Users can overlay the cycling layer with other datasets in Google Earth, such as congestion or infrastructure, to identify where interventions may be most effective.
Sarah-Jayne Williams, Director, Global Product Partnerships – Geo – EMEA, Google Maps, told Cities Today the dataset can provide more granular insights into cycling behaviour.

“The ‘cycling trip percentage’ data allows planners to analyse cycling use at the neighbourhood level and to compare cycling behaviour across different urban districts in their city and across the globe,” she said. “This data set can complement data that planners currently have available, like aggregated counts of cyclists on bike paths.”
The global scope of the dataset reveals patterns across different regions. While the Netherlands shows high cycling rates, cities in Japan display comparable levels for the same period. The data also highlights locations often underrepresented in traditional surveys focused on commuting, including college campuses and waterfront areas.
Examples include UC Santa Barbara, where cycling accounts for 16.7 percent of trip segments within one grid cell, compared to a lower city-wide figure captured in official statistics. In Brazil, the car-free city of Afuá records cycling shares above 60 percent.
The dataset is in its early stages, with cities still exploring how it can be applied in practice and how it may evolve over time.
“This data set has been available on Google Earth for just over a month so we are still learning about how cities might put this data to use,” Williams said. “This is the first version of this data set to be released and we welcome feedback from planners on ways we can improve it.”
Main image: Google Maps